Petrophysical Interpretation Report — 15-135-24,881-00-00
| Well (UWI) | 15-135-24,881-00-00 |
| Log date | Sat Feb 28 00-46-47 2009 |
| Service company | Log Tech |
| Acquisition date (header) | Sat Feb 28 00-46-47 2009 |
| PLSS location | Sec 12 T20S R22W (map precision ±1.6 km) |
| Larionov variant | old_rocks (degraded) |
| Convergence status | DID_NOT_CONVERGE |
| Confidence tier | ○ BRACKETED |
| Engine versions | calc_vsh 0.1.0 · calc_phie 0.1.0 · calc_sw 0.1.0 · formula_registry 0.1.0 |
| Config hash (SHA-256) | 2a9cb78728e386ab… |
| Git SHA | bd23bea18153 |
| Generated | autonomously, no human in the per-report loop |
Confidence legend. Each result is tagged by parameter provenance: ● FIRM (core-calibrated) · ◐ QUALIFIED (offset-derived) · ○ BRACKETED (regional/global default — read as a range, dominant uncertainty stated). The system does not claim *always correct*; it states how well-supported each number is.
1. Executive summary
⚠️ ABSTENTION — this is NOT a confident estimate. The run did not converge to a defensible result; the numbers below are an uncalibrated engineering estimate, reported for transparency only:
- 1 unresolved MECHANICAL objection(s)
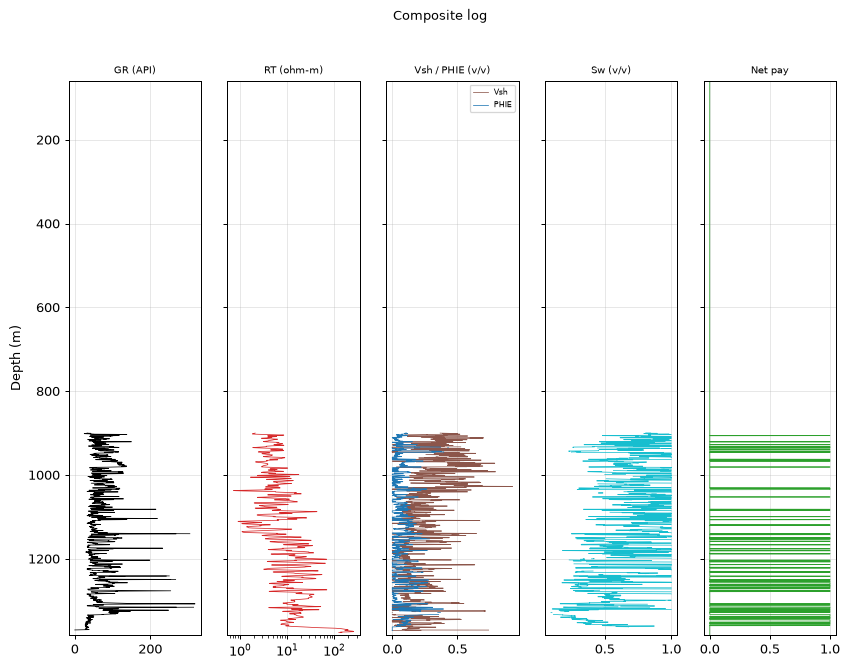
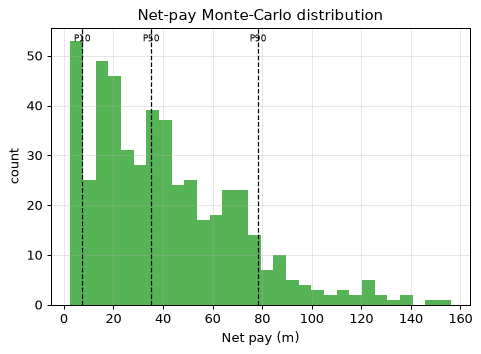
The evaluation is restricted to the consolidated section between 900.0 m and 1382.6 m — the interval above it is not evaluated (unconsolidated, washed-out response). Within that interval the net pay is 69.0 m with average effective porosity 0.180 and average water saturation 0.322. Monte-Carlo places the P50 net pay at 35.3 m within a P10-P90 range of 7.5 to 78.4 m. An independent SP-derived water resistivity of 0.0508 ohm-m (static SP -43.6 mV; offset-median mud-filtrate resistivity 0.110 ohm-m — a declared cross-well assumption) supports the regional default, and the Monte-Carlo Rw range is narrowed to the field SP band with recorded provenance. The Rxo/Rt movable-hydrocarbon index reads a median of 0.597 over 3117 samples — an invasion-based indicator profile, not a saturation. The run ABSTAINS from a confident estimate: the validators keep an unresolved objection, so the result must be read as a bracketed range, not a point value.
Net pay P10 / P50 / P90 = 7.5 / 35.3 / 78.4 m.
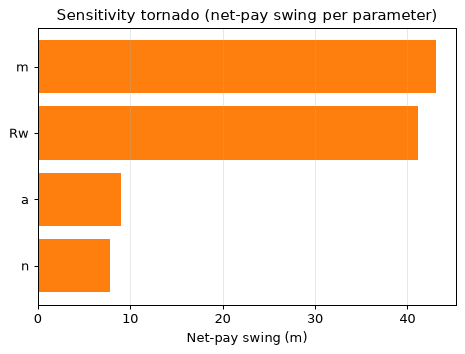
Net pay is dominated by 'm', which is a regional DEFAULT (uncalibrated). This is the single largest uncertainty — the result is bracketed, not a confident point estimate.
2. Data inventory (from LAS)
- Curves present (canonical ← raw): DCAL←DCAL, DRHO←RHOC, GR←GR, NPHI←CNLS, PHID_SVC←DPOR, RHOB←RHOB, RMED←RILM, RT←RILD, RXO←RLL3, SP←SP
- Logged interval: 59.44–1382.57 m
- Log date: Sat Feb 28 00-46-47 2009
- Service company: Log Tech · Company: Berexco, Inc.
- Field: Schaben
- Not provided by LAS (out of scope): core, mud logs, pressure tests, production, completion, formation tops.
3. LAS quality control
| Edit type | Curve | Detail |
|---|---|---|
| unit_conversion | NPHI | factor 0.01 |
| hard_range_mask | RXO | count 1 |
| hard_range_mask | RT | count 117 |
| hard_range_mask | RMED | count 95 |
| hard_range_mask | RHOB | count 1 |
| hard_range_mask | DRHO | count 4 |
| hard_range_mask | PHID_SVC | count 5 |
| range_warn | GR | count 4 |
| range_warn | RHOB | count 4 |
| range_warn | NPHI | count 3 |
| spike_removal | — | 89 edits |
| degradation | — | 3 edits |
4. Standardization
Raw mnemonics mapped to canonical curve names:
| Canonical | Raw mnemonic |
|---|---|
| DCAL | DCAL |
| DRHO | RHOC |
| GR | GR |
| NPHI | CNLS |
| PHID_SVC | DPOR |
| RHOB | RHOB |
| RMED | RILM |
| RT | RILD |
| RXO | RLL3 |
| SP | SP |
Unit conversions: NPHI×0.01.
5. Per-curve log QC
- GR baseline: gr_p5=34.4, gr_p95=110.4
- Bad-hole: GOOD=0.844, DEGRADED=0.127, EXCLUDED=0.029
- Low-resistivity: rt_threshold=1.79, n_flagged=848, intervals=[[278.6, 282.2], [284.2, 339.1], [345.5, 346.7], [361.8, 362.4], [366.8, 367.1], [399.9, 401.7], [419.9, 421.8], [458.6, 458.7], [459.8, 467.4], [478.7, 480.2]]
6. Data preparation
Edits applied before compute (by type): degradation: 3, hard_range_mask: 6, range_warn: 3, spike_removal: 89, unit_conversion: 1.
7. Interval definition
- Logged interval: 59.44–1382.57 m
- Analysis window (analyst-restricted): 900.0–1382.6 m — gross and NTG are measured over this window
- Gross evaluated interval: 482.6 m
- Computed net-pay runs (pre-merge): 76
- Zonation is computed by depth (no formation tops in LAS).
8. Methodology
All numbers are produced by the deterministic, golden-tested engine. The LLM only selects methods/parameters and writes prose — it never computes a number. Figures are deterministic renderings of these computed numbers for the human reader; the agent reasons over the numeric EDA digest, not images (the models have no vision).
| Step | Method (frozen) | Version |
|---|---|---|
| Vsh | 2-mineral volumetric solve (matrix+clay+porosity from RHOB+NPHI) | vsh_multimineral 0.1.0 |
| PHIE | Density-neutron crossplot, shale-corrected | phie_density_neutron 0.1.0 |
| Sw | Simandoux 1963 (shaly sand) | sw_simandoux 0.1.0 |
| Net pay | Vsh/PHIE/Sw cutoffs → net sand → net reservoir → net pay | netpay 0.1.0 |
| Uncertainty | Monte Carlo P10/P50/P90 + parameter sensitivity | mc 0.1.0 |
9. Gamma-ray analysis
- Clean baseline gr_min = 20.0 API · shale gr_max = 120.0 API
- Shale index IGR = (GR − gr_min)/(gr_max − gr_min), the basis for Vsh.
- GR baseline check: gr_p5=34.4, gr_p95=110.4
10. Resistivity analysis
Low-resistivity scan: rt_threshold=1.79, n_flagged=848, intervals=[[278.6, 282.2], [284.2, 339.1], [345.5, 346.7], [361.8, 362.4], [366.8, 367.1], [399.9, 401.7], [419.9, 421.8], [458.6, 458.7], [459.8, 467.4], [478.7, 480.2]].
Invasion profile (multi-depth resistivities, 8471 samples): fraction with shallow reading above deep (Rxo/RT > 1.2, invaded/permeable indication): 0.604; reversed (< 0.8): 0.098; median Rxo/RT 1.301; median Rmed/RT 0.961. Raw-curve facts; naming moveable hydrocarbon is the analyst's judgement.
11. Density-neutron crossplot lithology
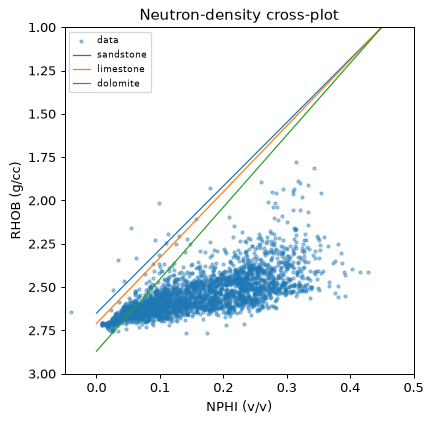
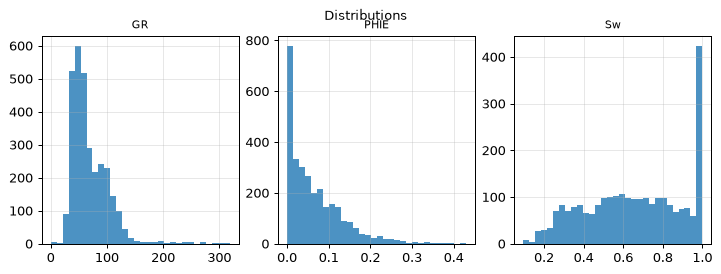
Matrix point-shares (fraction of points near each matrix line): sandstone: 0.091, limestone: 0.219, dolomite: 0.247. Engine crossplot output; naming the dominant lithology is the analyst's judgement. Comparison with core/mud log: not available (LAS-only).
12. Water resistivity (Rw)
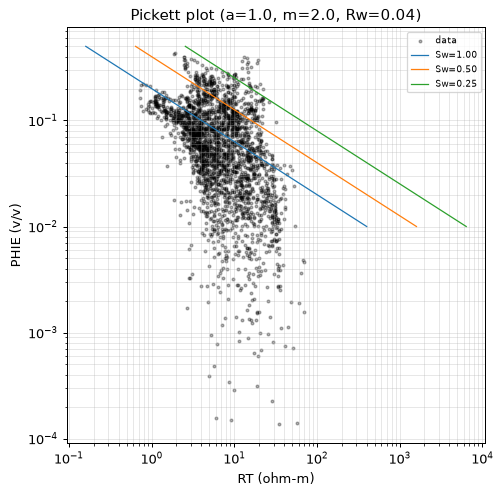
- Rw = 0.0400 ohm-m · provenance: default
- Sourced by the engine (Pickett / SP / default); never authored by the LLM.
- Net-pay sensitivity to Rw: 41.1 m swing.
- Formation-temperature correction (Arps, regional-default gradient): Rw ≈ 0.0128 ohm-m at 46.4 °C (evidence only — Sw uses the calibrated Rw).
13. Figures
Composite log
Pickett plot
Neutron-density crossplot
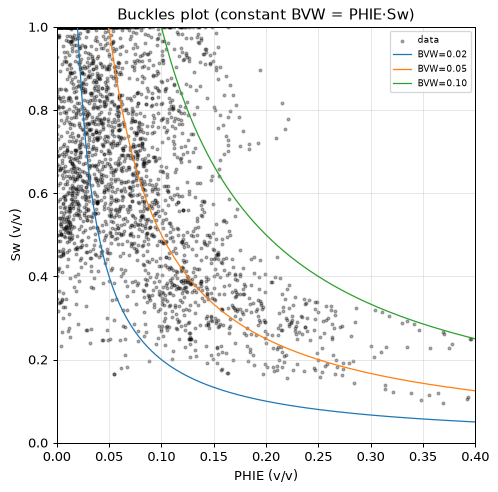
Buckles plot
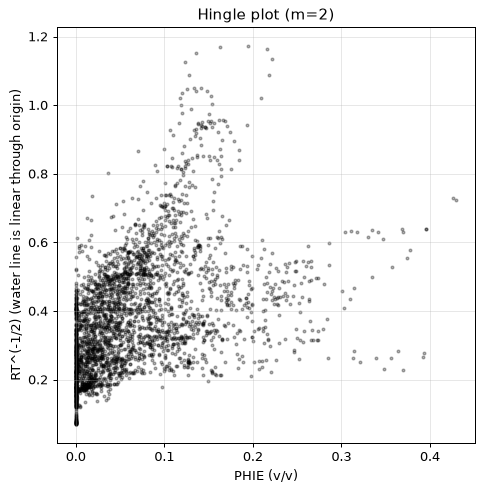
Hingle plot
Distributions
Sensitivity tornado
Net-pay Monte-Carlo distribution
14. Shale volume (Vsh)
Mean Vsh by method (selection is the agent's; the LLM authors no number):
| Method | Mean Vsh | Selected |
|---|---|---|
| vsh_larionov_old | 0.349 | |
| vsh_larionov_tertiary | 0.273 | |
| vsh_linear | 0.468 | |
| vsh_clavier | 0.333 | |
| vsh_steiber | 0.295 | |
| vsh_neutron_density | 0.252 | |
| vsh_multimineral | 0.233 | ✓ |
15. Porosity
Mean porosity by method (effective where shale-corrected; the LLM authors no number):
| Method | Mean porosity | Selected |
|---|---|---|
| phie_density_neutron | 0.073 | ✓ |
| phi_density | 0.095 | |
| phi_neutron | 0.154 |
Service-company porosity curves (cross-check evidence, full-column means): phid_svc: 0.197. Matrix assumptions differ per curve; agreement/disagreement is the analyst's reading.
16. Water saturation
Mean Sw (Simandoux 1963 (shaly sand)) = 0.657 (a=1.00, m=2.00, n=2.00, Rw=0.0239 ohm-m). Electrical parameters are engine-sourced; alternative Sw models are optional sections.
Mean Sw by method (engine-computed comparison; the LLM authors no number):
| Method | Mean Sw | Selected |
|---|---|---|
| sw_archie | 0.816 | |
| sw_simandoux | 0.657 | ✓ |
| sw_indonesia | 0.688 |
17. Zonation (net-pay intervals)
Raw net-pay runs merged into 45 intervals (gap tolerance 1.5 m); showing the 15 thickest, depth-ordered. Full set traces in the ledger.
| Interval | Top (m) | Base (m) | Net pay (m) | Avg PHIE | Avg Sw | Avg Vsh |
|---|---|---|---|---|---|---|
| Z1 | 942.7 | 946.1 | 2.6 | 0.326 | 0.280 | 0.033 |
| Z2 | 1031.1 | 1034.9 | 3.7 | 0.210 | 0.362 | 0.105 |
| Z3 | 1140.1 | 1142.5 | 1.5 | 0.173 | 0.340 | 0.171 |
| Z4 | 1149.2 | 1153.2 | 2.3 | 0.202 | 0.339 | 0.169 |
| Z5 | 1203.2 | 1207.3 | 1.8 | 0.157 | 0.338 | 0.096 |
| Z6 | 1220.4 | 1222.6 | 2.1 | 0.159 | 0.342 | 0.037 |
| Z7 | 1241.0 | 1242.5 | 1.7 | 0.154 | 0.341 | 0.052 |
| Z8 | 1256.8 | 1260.3 | 3.7 | 0.213 | 0.286 | 0.160 |
| Z9 | 1261.9 | 1268.9 | 5.3 | 0.181 | 0.305 | 0.208 |
| Z10 | 1275.4 | 1278.3 | 2.1 | 0.175 | 0.319 | 0.168 |
| Z11 | 1315.1 | 1317.3 | 2.4 | 0.249 | 0.259 | 0.051 |
| Z12 | 1319.3 | 1320.7 | 1.5 | 0.265 | 0.184 | 0.000 |
| Z13 | 1332.9 | 1337.0 | 4.3 | 0.175 | 0.217 | 0.103 |
| Z14 | 1338.7 | 1343.6 | 3.8 | 0.132 | 0.243 | 0.161 |
| Z15 | 1346.0 | 1356.7 | 8.1 | 0.120 | 0.383 | 0.123 |
18. Results
| Quantity | Value |
|---|---|
| Gross interval | 482.6 m |
| Net pay (P10/P50/P90) | 7.5 / 35.3 / 78.4 m |
| Net-to-gross | 0.143 |
| Avg PHIE (net pay) | 0.180 |
| Avg Sw (net pay) | 0.322 |
| Avg Vsh (net pay) | 0.125 |
19. Uncertainty and sensitivity
Monte Carlo, 500 realizations (seed 42). Net pay swing per parameter (one-at-a-time):
| Parameter | Net-pay swing (m) |
|---|---|
| m | 43.1 |
| Rw | 41.1 |
| a | 9.0 |
| n | 7.8 |
Dominant uncertainty: m (swing 43.1 m).
Multi-seed robustness: P50 stable (spread 3.1 m across 4 seeds).
Net pay is dominated by 'm', which is a regional DEFAULT (uncalibrated). This is the single largest uncertainty — the result is bracketed, not a confident point estimate.
20. Derived parameters
- Bulk-volume water (BVW = PHIE*Sw): mean 0.0417 v/v
- Porosity-thickness (Phi·H over net pay): 12.405 m
- Hydrocarbon pore thickness (HCPV = Σ PHIE·(1−Sw)·step): 8.642 m
- Buckles constant (BVW at P10 of net pay): 0.0348 → Swirr (mean) ≈ 0.194 over 453 pay samples
21. Parameters and provenance
| Parameter | Value | Unit | Provenance | Source |
|---|---|---|---|---|
| gr_min | 20.000 | API | default | — |
| gr_max | 120.000 | API | default | — |
| rho_ma | 2.710 | g/cc | default | Schlumberger 1989 |
| rho_fl | 1.000 | g/cc | default | — |
| phie_max | 0.450 | v/v | default | — |
| phi_sh_d | 0.100 | v/v | default | — |
| phi_sh_n | 0.350 | v/v | default | — |
| a | 1.000 | - | default | Winsauer et al. 1952 |
| m | 2.000 | - | default | Archie, G.E. 1942 |
| n | 2.000 | - | default | Archie, G.E. 1942 |
| Rw | 0.040 | ohm-m | default | Kansas Geological Survey 2000 |
| rt_hydrocarbon_floor | 5.000 | ohm-m | default | — |
| vsh_cutoff | 0.350 | v/v | default | — |
| phie_cutoff | 0.100 | v/v | default | — |
| sw_cutoff | 0.500 | v/v | default | — |
| bit_size_config | 7.875 | in | default | — |
| qc_abort_threshold | 0.800 | - | default | — |
| circuit_breaker_n | 3.000 | - | default | — |
The citations table (not RAG) gives each cited parameter exactly one frozen source. Parameters tagged
defaultare regional/global — they drive the bracketed tier.
22. Petrophysical cutoffs
Boundary-inclusive criteria applied by the engine (netpay) to flag reservoir:
| Stage | Criterion | Cutoff | Provenance |
|---|---|---|---|
| Net sand | Vsh ≤ cutoff | 0.350 | default |
| Net reservoir | + PHIE ≥ cutoff | 0.100 | default |
| Net pay | + Sw ≤ cutoff | 0.500 | default |
Cutoff values are engine parameters (never LLM-authored); the dominant net-pay uncertainty is m — see Uncertainty for the swing.
23. Data quality and validator objections
Curve provenance (canonical ← raw mnemonic): DCAL←DCAL, DRHO←RHOC, GR←GR, NPHI←CNLS, PHID_SVC←DPOR, RHOB←RHOB, RMED←RILM, RT←RILD, RXO←RLL3, SP←SP.
QC edits applied before compute — degradation: 3, hard_range_mask: 6, range_warn: 3, spike_removal: 89, unit_conversion: 1.
| Validator | Type | Detail |
|---|---|---|
| vsh_phie_anticorrelation | support | Vsh-PHIE Pearson 0.99 > 0.3 (dirty rock + high porosity) |
| rt_sw_consistency | mechanical | 88 depths with Sw<0.4 but RT<5.0 ohm-m |
24. Methodology (decision graph)
flowchart TD
    dec_1["decision: step: set_zone_of_interest"]
    act_1["tool_call: set_zone_of_interest"]
    dec_2["decision: step: compare_methods"]
    act_2["tool_call: compare_methods"]
    dec_3["decision: step: compute_vsh"]
    act_3["tool_call: compute_vsh"]
    dec_4["decision: step: compute_phie"]
    act_4["tool_call: compute_phie"]
    dec_5["decision: step: compare_methods"]
    act_5["tool_call: compare_methods"]
    dec_6["decision: step: compute_sw"]
    act_6["tool_call: compute_sw"]
    dec_7["decision: step: apply_cutoffs"]
    act_7["tool_call: apply_cutoffs"]
    dec_8["decision: step: run_uncertainty"]
    act_8["tool_call: run_uncertainty"]
    dec_9["decision: step: derived_parameters"]
    act_9["tool_call: derived_parameters"]
    dec_10["decision: step: lithology"]
    act_10["tool_call: lithology"]
25. Data gaps for calibration
This is a LAS-only study. Data that would calibrate the interpretation is absent:
- Core (routine + SCAL): would anchor PHIE and Archie m, n, a.
- Pressure tests (RFT/MDT): would give true fluid contacts and gradients (log-based).
- Production/flow data: would test the net-pay flag against deliverability.
- Dominant net-pay uncertainty driver (from the sensitivity): m (calibrated by core SCAL — cementation exponent m).
- Standard curves absent: DT, PEF, CALI.
26. Limitations
- LAS-only study: no core calibration, no pressure tests (no true fluid contacts), no production, no mud logs, no formation tops (zonation computed by depth).
- Standard curves absent in this well: DT, PEF, CALI.
- Results are uncalibrated; accuracy depends on data not provided.
27. Conclusions
Competent well above 900 too, but the 900 m scope floor applies (Permian out of target). Multimineral clay ~0.26 -> Simandoux. Method choices were made against the engine's numeric comparisons, not by preference; the comparison tables show the rejected alternatives beside the selected method. All numbers in this report come from the deterministic engine; the analyst chose the interval, the methods and the analyses, and wrote this prose — nothing more. Remaining uncertainty is dominated by the uncalibrated regional parameters.
Appendix A — Ledger excerpt (traceability)
{
  "net_pay_total_m": 69.03720000000004,
  "net_pay_p10_p50_p90": [
    7.4676000000000045,
    35.28060000000002,
    78.39456000000006
  ],
  "driving_params": {
    "a": 1.0,
    "m": 2.0,
    "n": 2.0,
    "Rw": 0.04
  },
  "claim_verifier": {
    "result": "PASS",
    "flags": [],
    "tone_flags": []
  }
}
Appendix B — Completeness gate
| Item | Present |
|---|---|
| QC edits recorded before compute | ✓ |
| Every number ledger-traced | ✓ |
| Confidence tier on the run | ✓ |
| Parameter citations frozen | ✓ |
| Validator objections listed, not hidden | ✓ |
| Uncertainty propagated (Monte Carlo) | ✓ |
| Claim verifier run on prose | ✓ |